The Rock Cloud now has the ability to handle custom LiDAR classification schemes. We know that not everyone follows the ASPRS classification scheme within their organization. This is particularly the case for autonomous vehicle companies, utility companies, and other organizations that have highly specialized classification schemes.
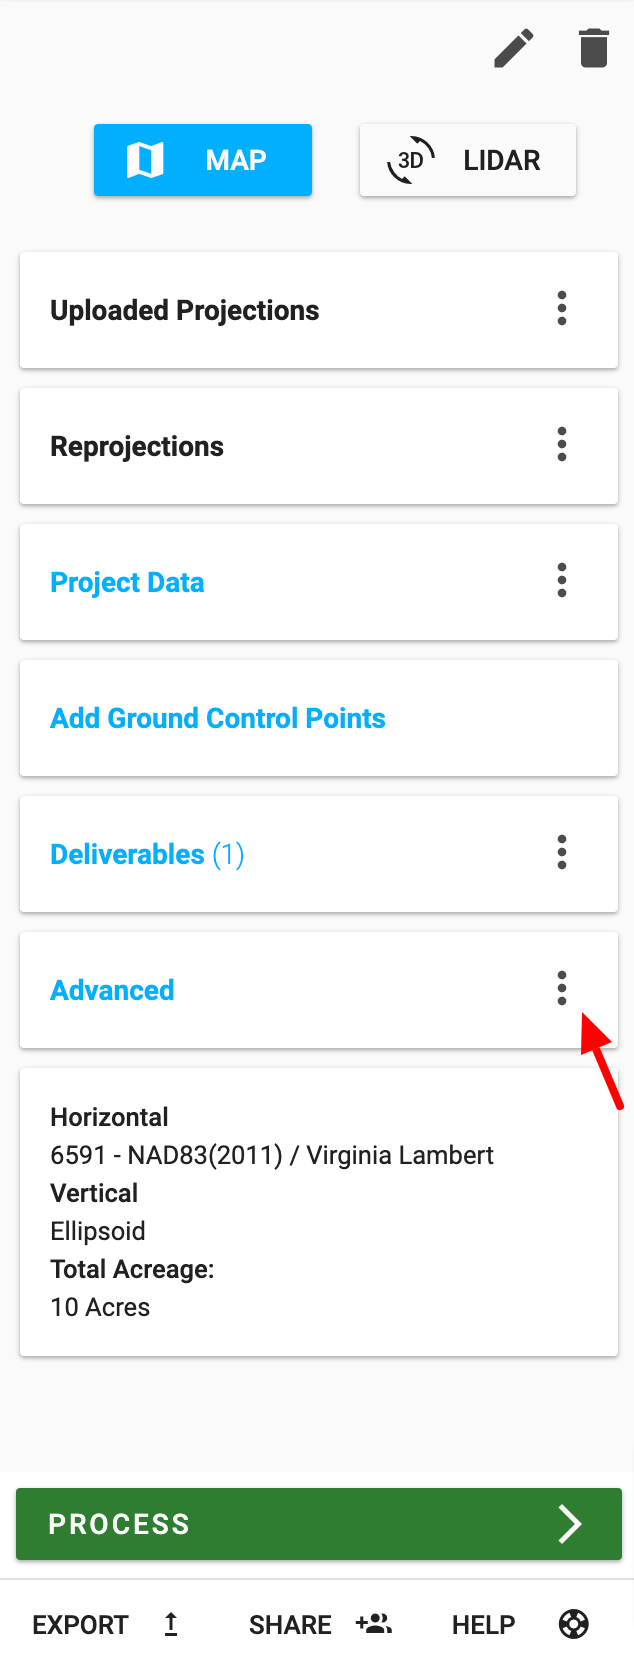
Now, if you navigate to Edit under Advanced:
You can select from a drop down different LiDAR classification schemes:
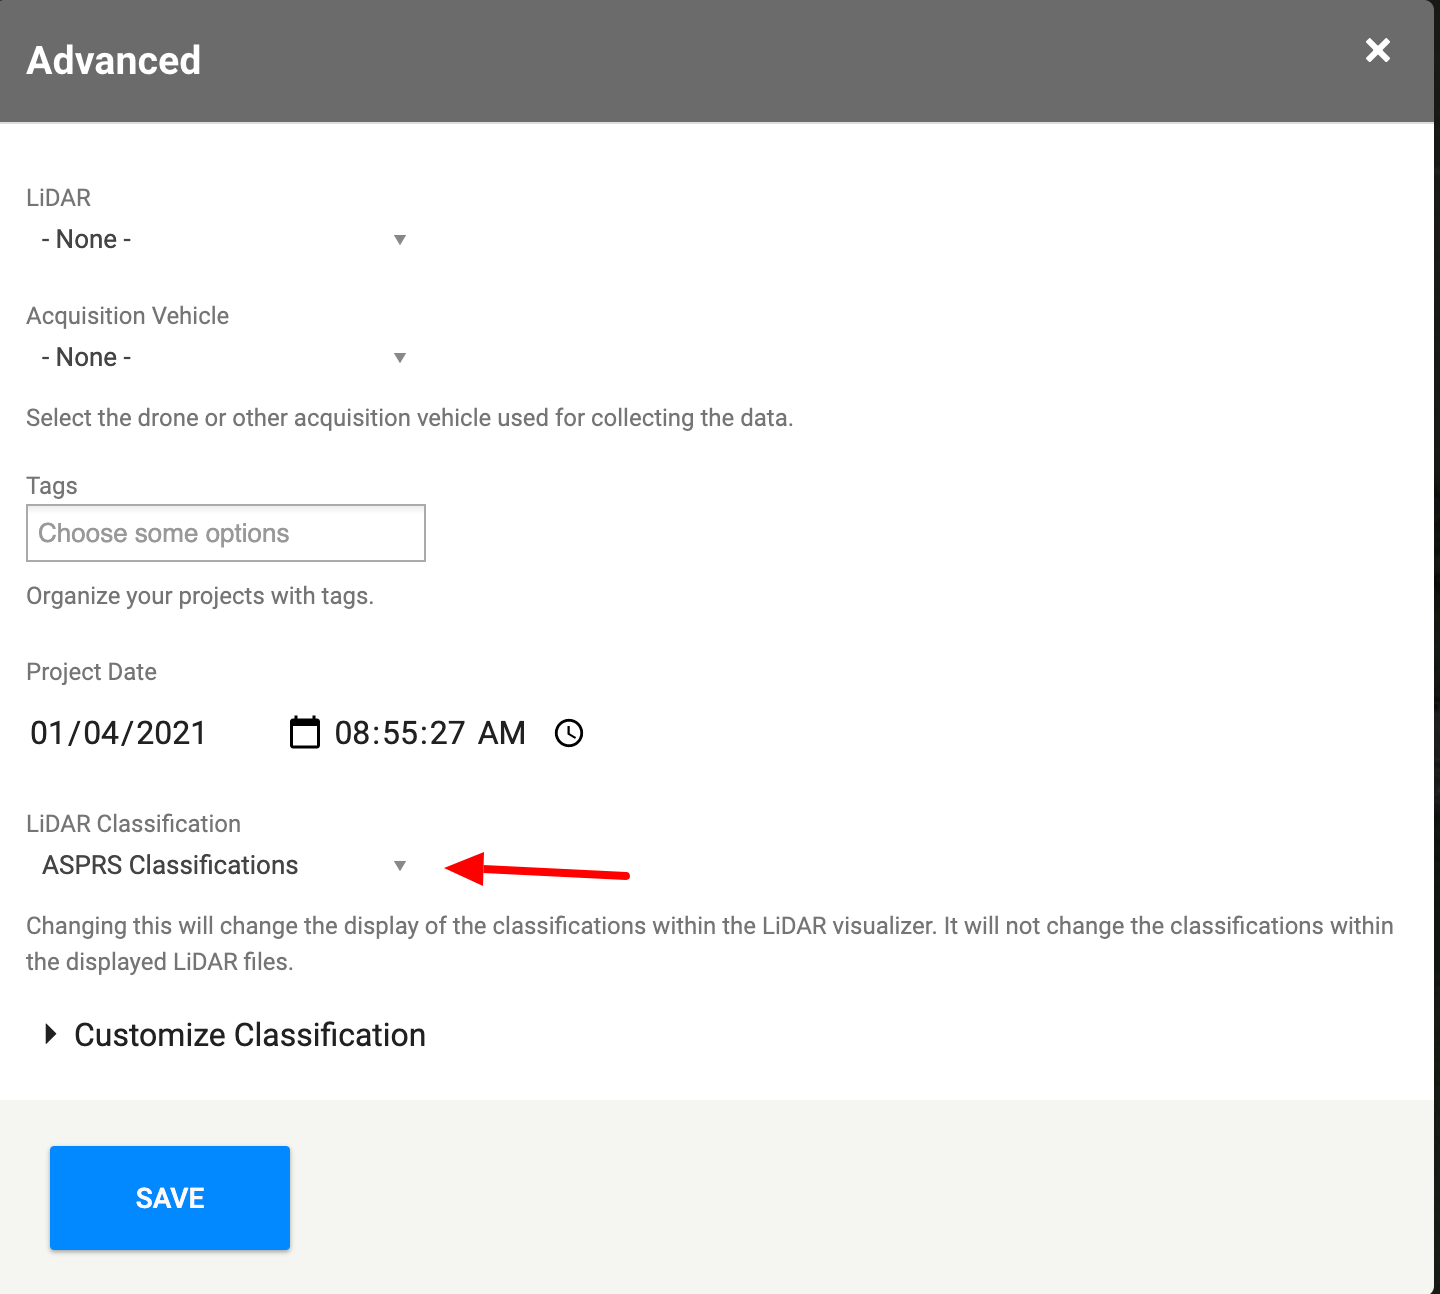
Note: This does not change the underlying data. This only changes the display of the data within the Rock Cloud.
Custom Classification
We will continue to add standard classification schemes to our platform. But, if you have a very custom classification scheme you can add them using the ‘Custom Classification’ widget.
The custom classification widget is configured using a text format called YAML.
Simply copy this template YAML and make changes as needed:
- 0:
  name: 'never classified'
  color: [0.5,  0.5,  0.5,  1.0]
- 1:
  name: 'unclassified'
  color: [0.5,  0.5,  0.5,  1.0]
- 2:
  name: 'ground'
  color: [0.63, 0.32, 0.18, 1.0]
- 3:
  name: 'low vegetation'
  color: [0.0,  1.0,  0.0,  1.0]
- 4:
  name: 'medium vegetation'
  color: [0.0,  0.8,  0.0,  1.0]
- 5:
  name: 'high vegetation'
  color: [0.0,  0.6,  0.0,  1.0]
- 6:
  name: 'building'
  color: [1.0,  0.66, 0.0,  1.0]
- 7:
  name: 'low point(noise)'
  color: [1.0,  0.0,  1.0,  1.0]
- 8:
  name: 'key-point'
  color: [1.0,  0.0,  0.0,  1.0]
- 9:
  name: 'water'
  color: [0.0,  0.0,  1.0,  1.0]
- 10:
  name: 'rail'
  color: [0.31,  0.47,  0.62,  1.0]
- 11:
  name: 'road surface'
  color: [0.65,  0.65,  0.65,  1.0]
- 12:
  name: 'overlap'
  color: [1.0,  1.0,  0.0,  1.0]
- 13:
  name: 'wire--guard (shield)'
  color: [1.0,  0.53,  0.0,  1.0]
- 14:
  name: 'wire--conductor (phase)'
  color: [0.98,  0.00,  0.22,  1.0]
- 15:
  name: 'transmission tower'
  color: [0.29,  0.42,  0.8,  1.0]
- 16:
  name: 'wire structure connector'
  color: [1.0,  0.0,  0.78,  1.0]
- 17:
  name: 'bridge deck'
  color: [0.85,  0.85,  0.85,  1.0]
- DEFAULT:
  name: 'default'
  color: [0.3,  0.6,  0.6,  0.5]
The format is:
- 2: <-- classification number in the las file.
  name: 'ground'     <-- Name to show up in the visualizer
  color: [0.63, 0.32, 0.18, 1.0] <-- color using percent based rgba