I’ve read or been told that the R2A may only have so much “arc seconds” of separation before the data becomes less reliable.
Ok… and I watch those fancy graphs while my processor is doing its mathimagics, however, I don’t totally understand what I am looking at/for… only that some of the graphs are way more wild than others.
I’ve seen UAV trajectory, vehicle and pedestrian tajectories… what’s the difference?
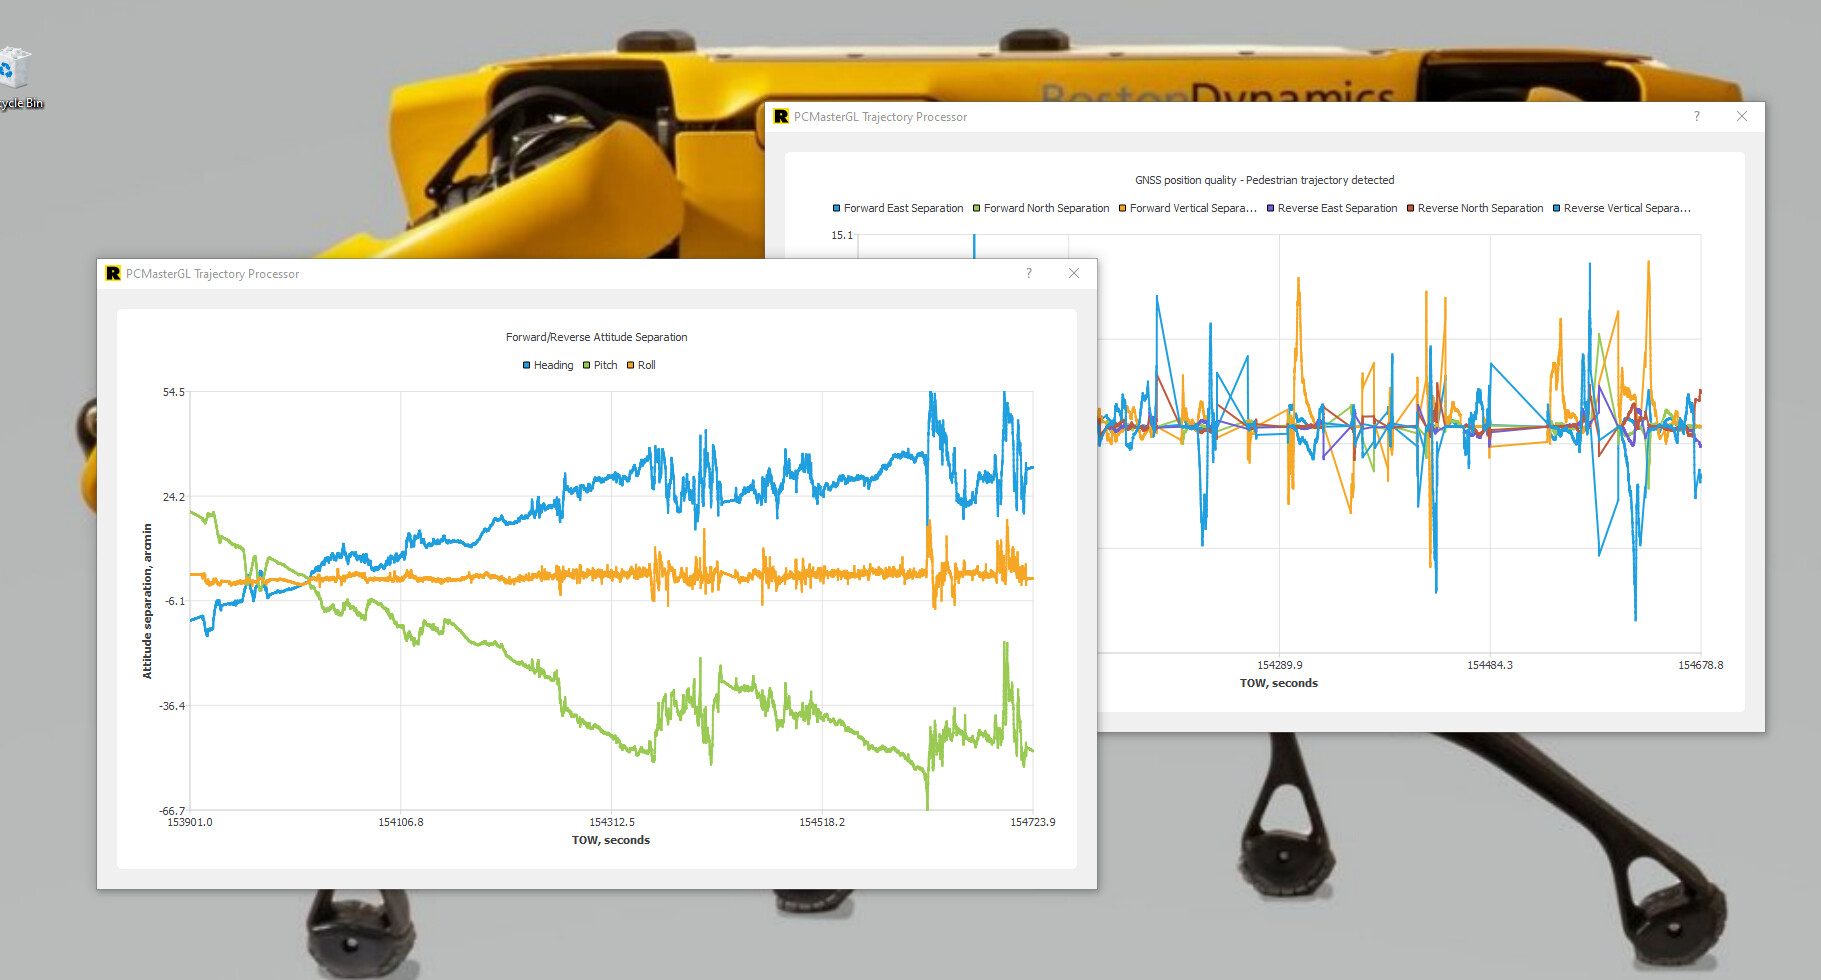
How do I know when I’ve failed my mission? Please see:
This was NOT done on my UAV, but mounted to a terrestrial vehicle.
Does it look okay? Is there a guide anywhere that goes more in depth?
Cheers
Well, that data did not turn out. At all…
To use a baking analogy… the cake fell flat.
For anyone reading this, I believe this “bad” data was generated because the “start up” procedures were not followed correctly (I don’t think I did the figure 8’s after the high speed alignment, oops)
Have you tried the new software and firmware yet? I believe that the profiles are no longer a thing with the new version.
I have had good luck with mobile scans, but you need to make sure that you do your High Velocity as well as the double 8s before you get started, and certainly don’t forget the final high velocity either.
In regards to the graphs. The new software version will output reports that might help to see the end process and what PCMaster is doing. It’s also useful for us to analyze instead of sending the entire project to us for support.
good Day! Looking first at the GNSS quality output. In this plot you can see several straight line segments. What is happening here is lost GNSS signal and then it locks in again. So it will have good quality, thats a point. then lost signal, then gets it again and this is the second point and the straight line between the points will be lost signal. While the PCMaster software is robust, it can’t combat this much loss in GNSS signal.
There are solutions we are working on to offer a robust GNSS denied solution. This is still in work
Cheers
Thanks for this… I had no idea how to interpret the graph.
I will try this area again… it is very challenging urban street with very large, mature trees, houses of all types of density and a large hospital. The sky view is very limited.