The Rock Cloud Project Visualizer creates an easy way to organize and view your LiDAR data.
Map View
The map view will display your project location, the flight lines, and your ground control points. This view is great for understanding where your LiDAR data is located in the world.
LiDAR View
The LiDAR visualizer allows you to view and analyze your 3D point cloud. Some of the most popular tools are:
Currently, the base package of the R1A with the ROCK cloud does not come with integrated RGB camera. We have developed an integrated Sony A600 or FLIR pointgrey camera system, it is coming soon. But in my personal experience of 5 years of providing UAS services. With which I own and operate the Riegl with integrated Sony RGB camera as well as Velodyne and camera, we never use the photos from the co-aligned camera. For best results we fly a separate photogrammetry mission and compute an orthomosaic and then combine the orthomosaic with the LiDAR data.
The reason is this. Typically our client wants an orthomosaic along with the LiDAR data. When you fly the LiDAR for optimal flight path for LiDAR data acquisition, the flight line spacing is not the same as an optimal forward and side overlap for photo capture for photo orthomosaic generation. We found it easier and faster to fly a second drone, Phantom 4 RTK to capture the dedicated photos for the orthomosaic.
This being said, We can accomodate the colorization of LiDAR data from orthomosaic. Please contact us for enterprise plan and we can talk.
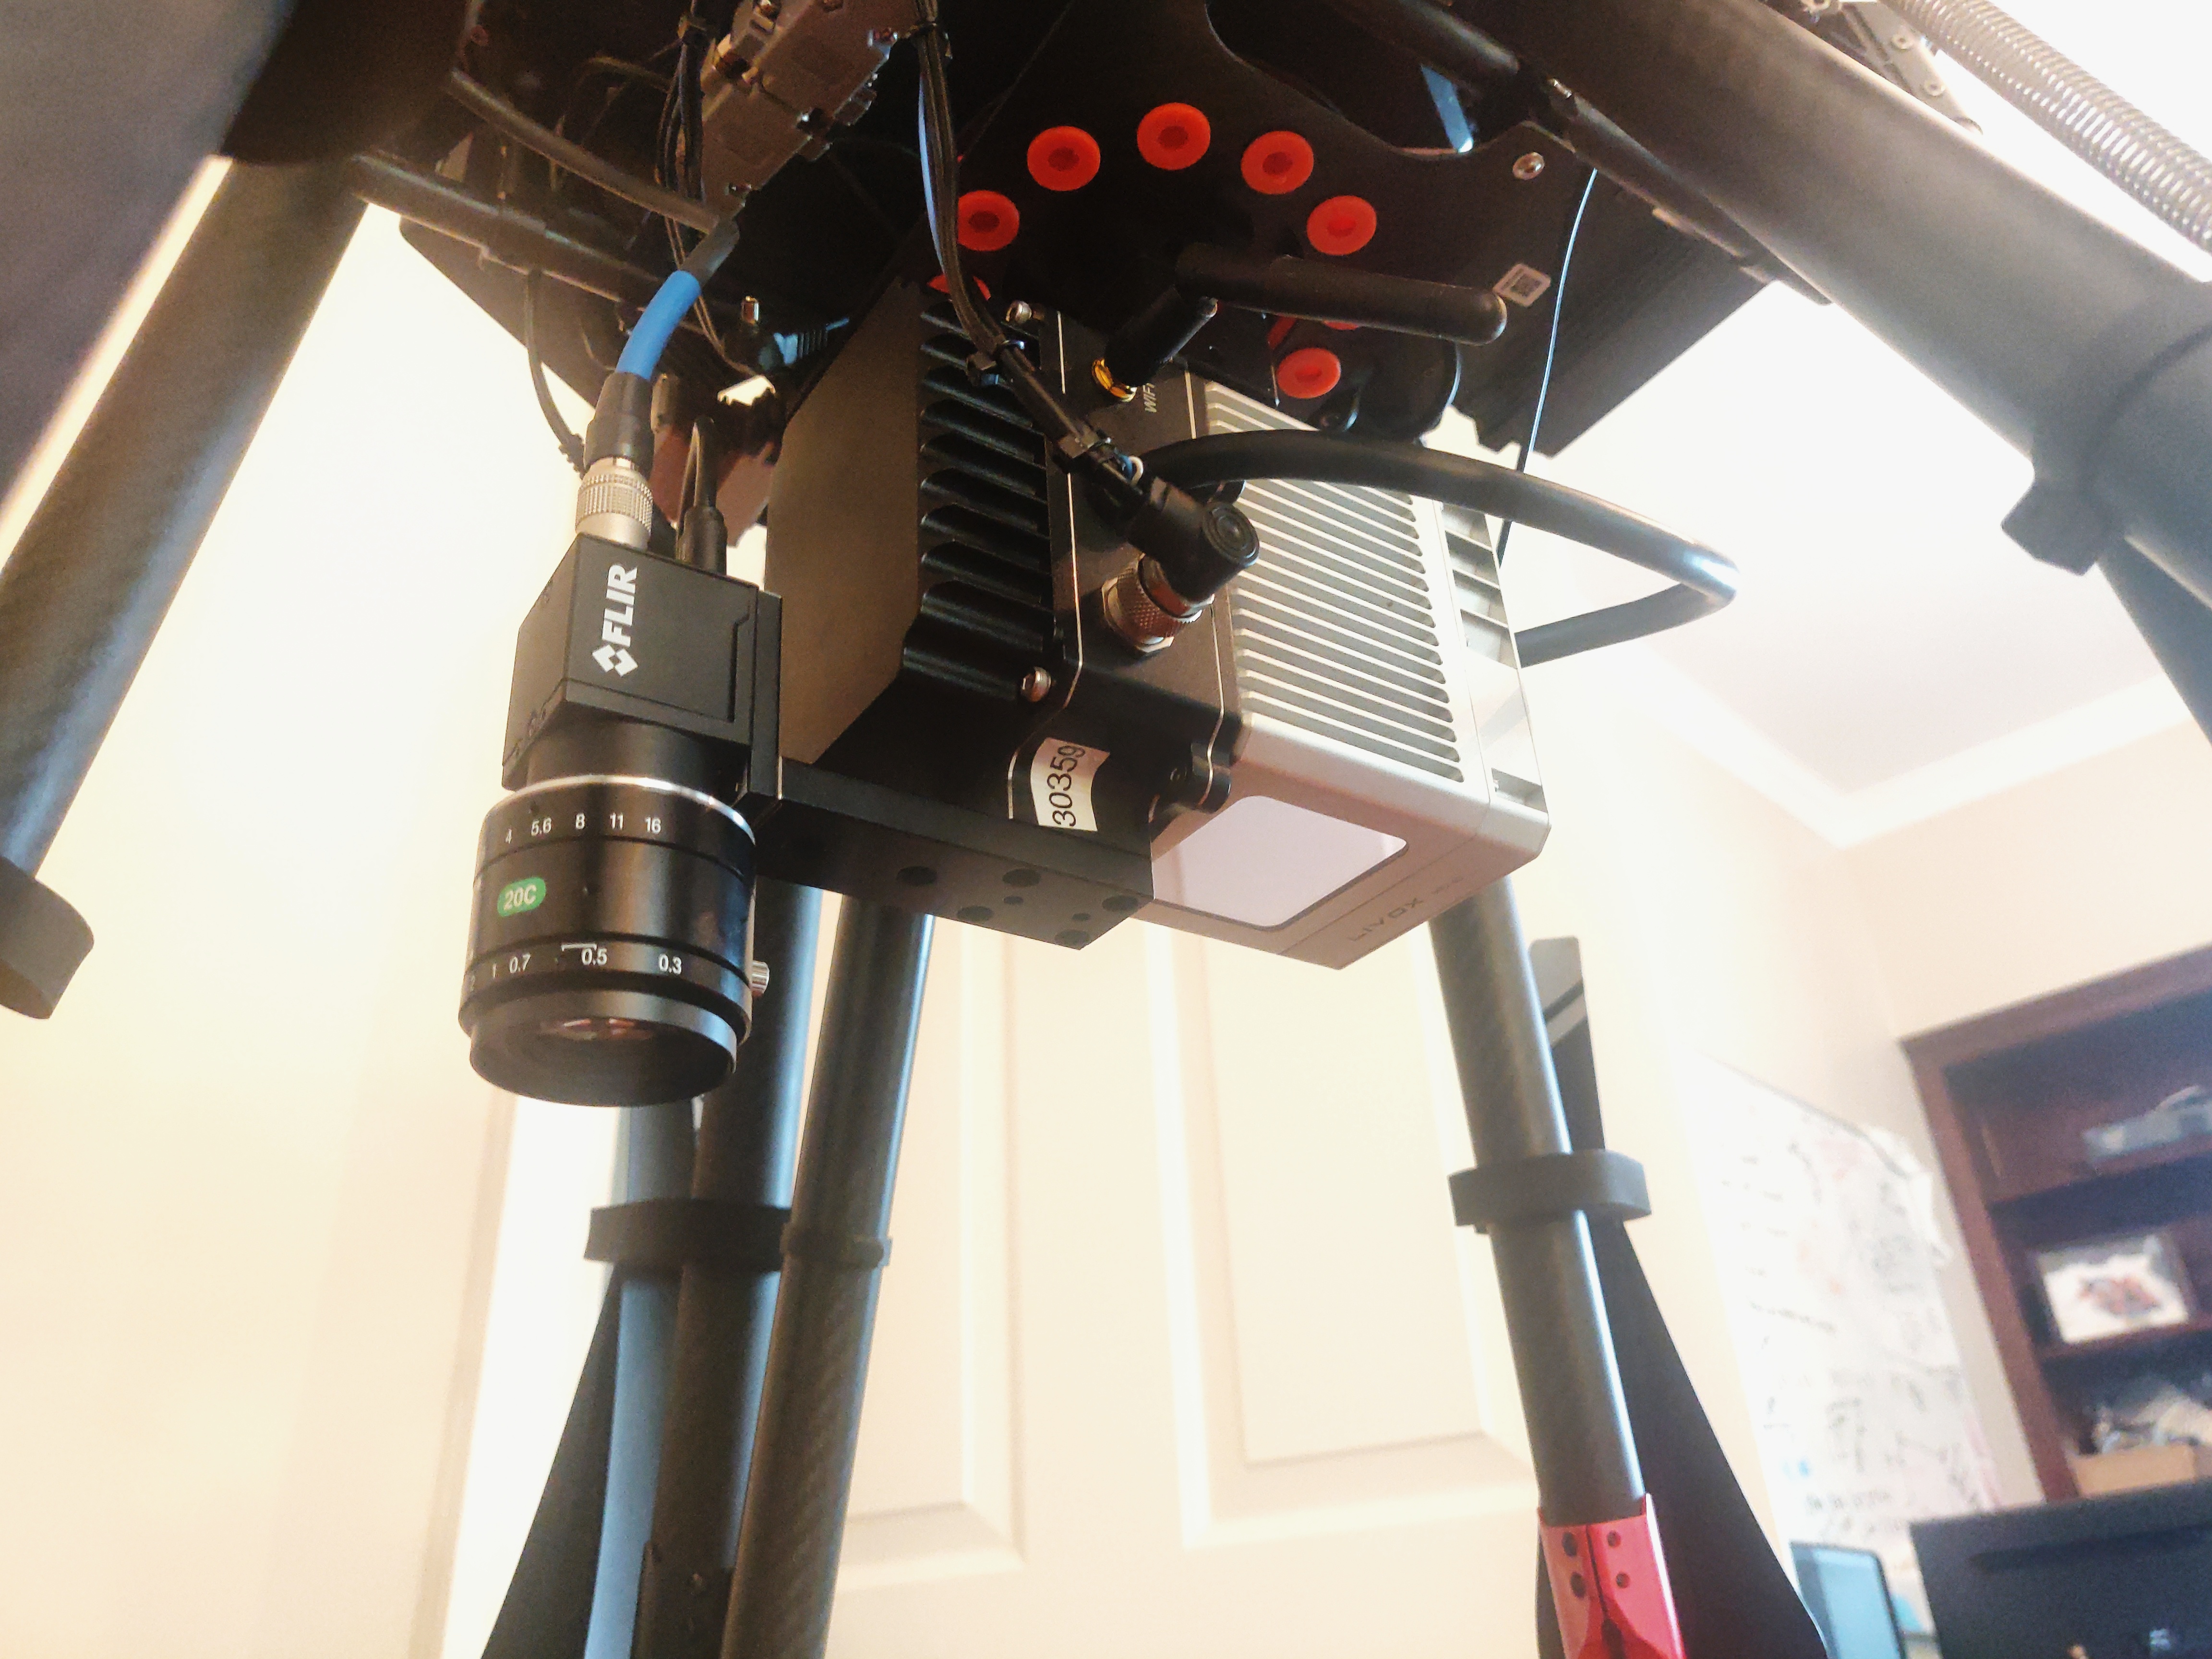
Additionally, Here is a sneak peak at our integration with FLIR pointGrey RGB camera…