Display contours on the Rock Cloud

Ordering the Rock Surveyor package gives you contour deliverables. You can see those contours in the cloud by selecting the layers icon:
image

Selecting the down arrow next to your project name:
image

And then toggling the contours from low to high:

image

It is often easier to see the contour lines when you ‘Show Ground Only’:

image

You can also download your contour deliverables by clicking the ‘Deliverables’ link on the left menu:

1 Like

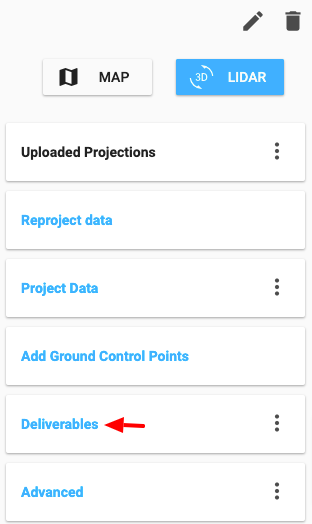
Is there any way to add another format to the deliverables? I want to be able to share a cad format like dwg or dxf of the contours created without having to perform extra steps locally.

1 Like

@smf Do you have a preference between dxf or dwg?

Either format would work. DWG is native to AutoCAD but DXF is more universal and might benefit a larger user base.

I’ll add a ticket for the development team now!

Thank you for the feedback!

1 Like

I see that the DXF format was added under the export “rock surveyor vector shapes”.
Thanks for the add. This helps get all the data we need into our BIM pipeline.

2 Likes

These guys work fast! Keep up the great suggestions!

1 Like

Low, Medium, and High denote what footage interval?

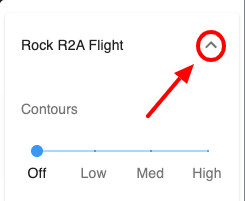
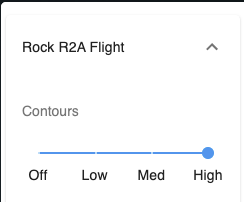
Low is every 5th contour, Med is every 2nd contour (excluding those from Low) and High is every contour (excluding Med, Low). They don’t correspond to the foot per se, but pertain to the selection when ordered.

So if I uploaded shp files based on 1 foot, what would they show?

Low would be 5 fts Medium would be 2 foots and high would be 1 foots, right?

1 Like

That is correct. Would it be vitally helpful to have them labeled on the slider?

3 Likes

that would be fantastic. Labeling the elevation on the contours or letting them be selectable would be great.

what exactly do you mean by selectable?

Selectable… Well, if we had a window that pops open and the query simply asks us: “What contour interval would you like today?” Please select your MINOR contour interval (my fav is 0.25m) and your MAJOR contour interval (my fav is 2.0m).
It should not matter what the intervals are, as we have all the data?

I was meaning I’d like to click the contour and see what elevation it is to compare to the GCP’s while in the Rock Cloud (I do this in CAD now just would be easier/faster to have it in the cloud)

@Daniel Thanks for the suggestion. We’ll get a story in our backlog and see what we can do.

@FlyingRadioWaves Not sure I quite understand. The contours are loaded statically (not dynamically generated). What would min/max show?

Contour data is static? NO… the topography is defined and we measure it… what I am trying to communicate is that I would like to choose my OWN contour intervals, set to whatever I want to see… So the “min” values, or the “minor contours” could be queried as any value, and the same with the “major contours”… all I am asking is that the user be allowed to set what values we see… and the computer should be able to generate that from the static topo data.

Out here in flat land, 0.25m minor and 1.0m major gives nice definition. I am sure in places where there is more topography, they might want different contour interval values.

Thanks for the explanation!

Just to clarify: The contours as displayed and ordered are static and generated when processing/reprocessing.

We can definitely work on getting the display to be more flexible than the slider and will get that into that work into the backlog.