Was looking at doing break lines through your program. Just clicking on the service popped up an “Enhanced Area” in the visualizer. “Enhanced Area” in the visualizer. Where can I find that part of the program.
Also on the Flood plain model is really good anyway of making that an deliverable? Based on a certain elevation?
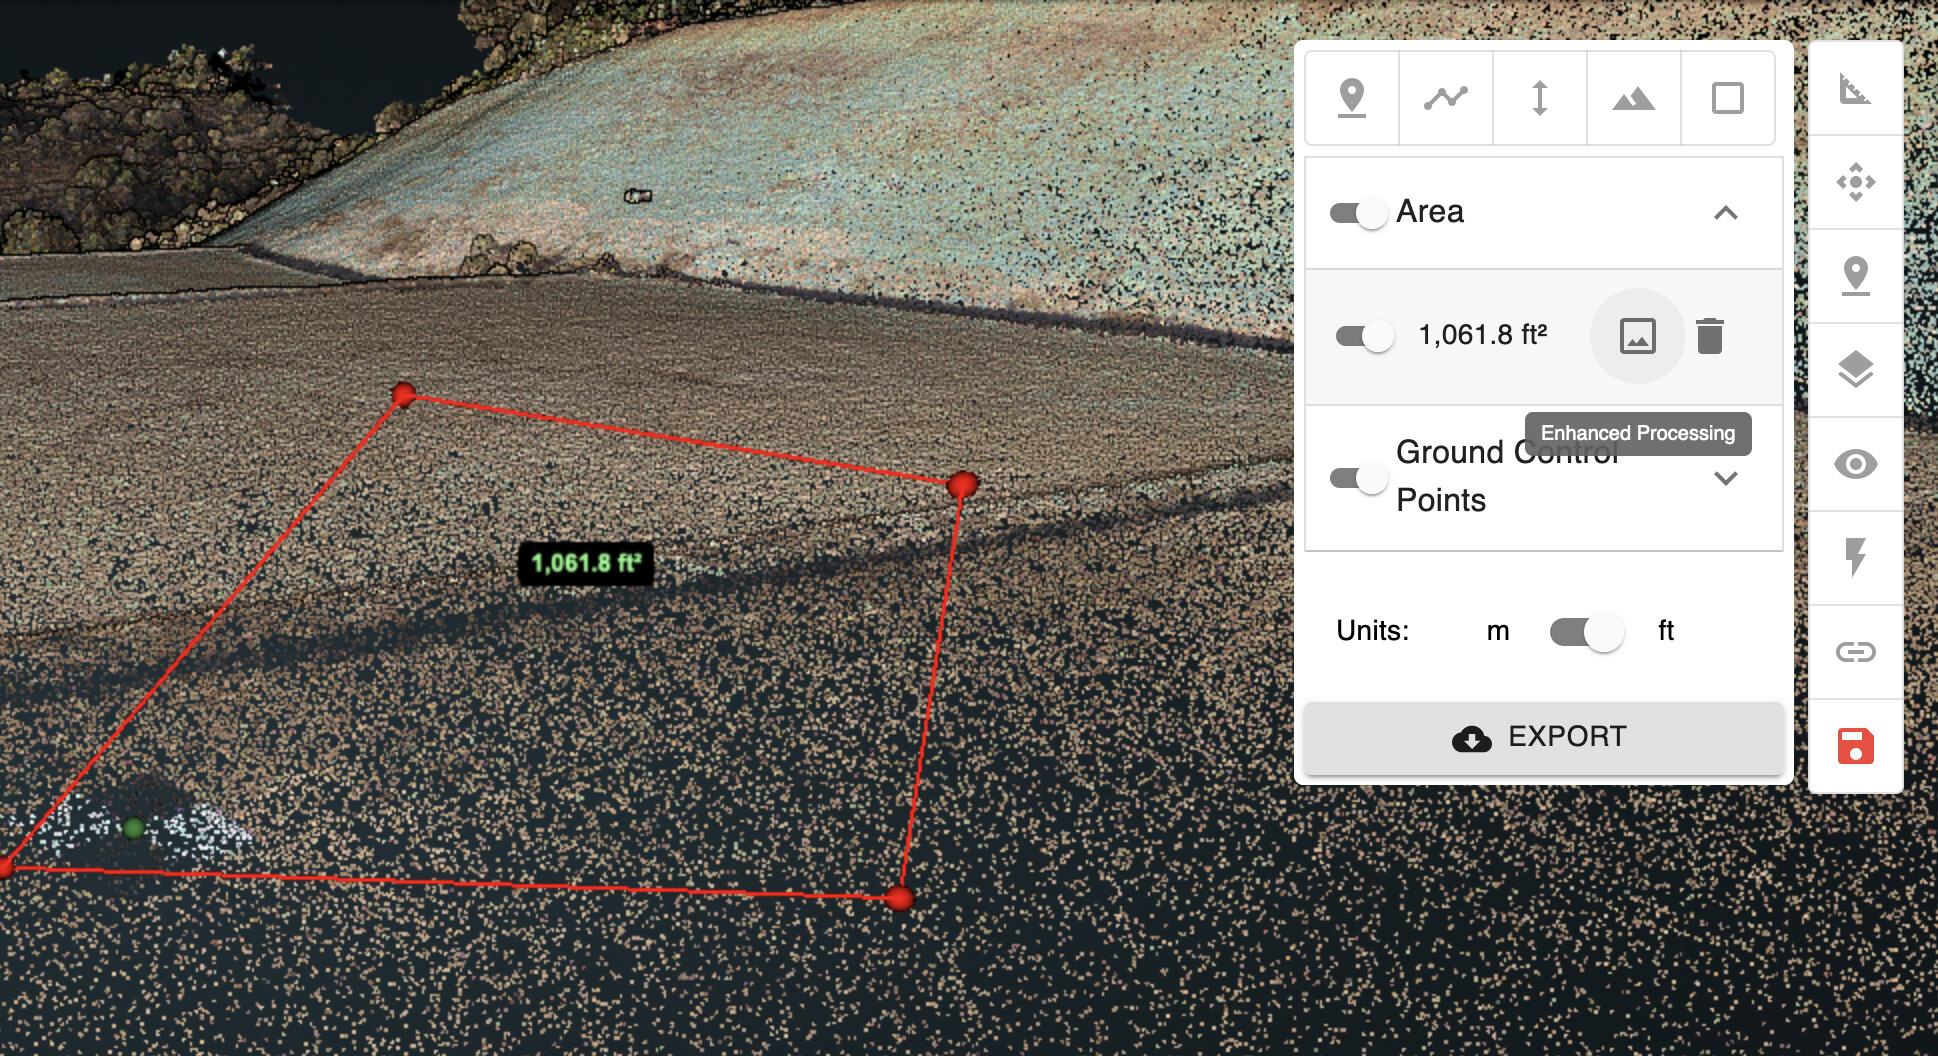
To use enhanced area, draw an area with the area tool in the toolbar and then click the picture icon next to the area. Once you do that, make sure to save by clicking the red save icon.
Thanks, As far as the Flood map. Something like the RGB view top down, then setting the flood elevation, then exporting that as a tiff or JPEG. Just a thought, showed it to a client and they really liked it for a FEMA plan, but need to get it in a 2D print.
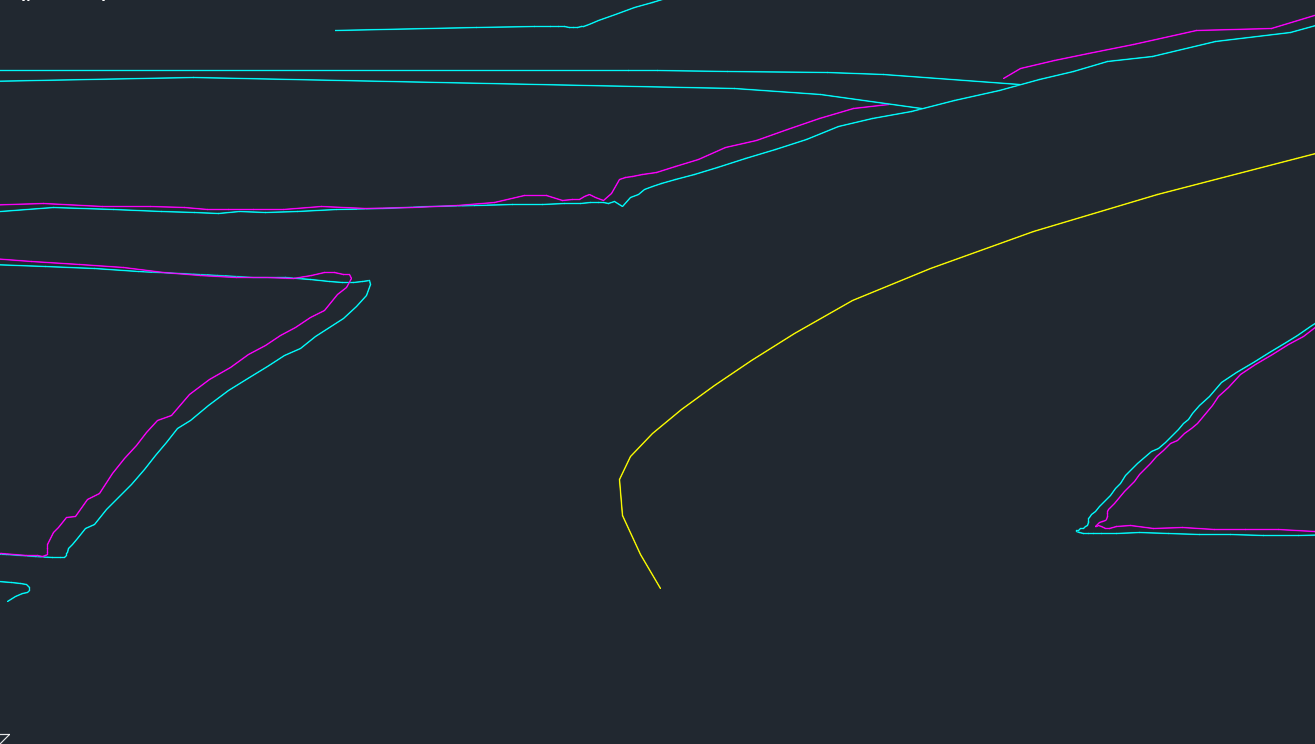
I used the breaklines feature to try to assist in vertical accuracy of my survey in civil 3d, but I am noticing that the breaklines dont seem to be accurate vertically. Especially with respect to the curb, centerlines, and flowlines. ( which is why I need them ) Is there something than can be done to use the Rock Cloud to generate vertically accurate curb lines? I’ve attached a picture of the breaklines that received.