We are having some issues with visually boresighting the R2A laser and camera. Within PCMaster / Painter, you cant zoom in or pan practically past a certain point. This makes it very hard to “get right in there” to align trajectories very precisely. Best guess is 10cm or so.
I am hoping this is not something to do with our GPU but we have run this on a number of machines, each with either integrated GPU or standalone (GeForce RTX 3080) with the same issue.
While we wait patiently for the trajectory to be exported in a recognizable format like SBET (something the developers have promised from day 1), would someone like to have a crack at this and offer their suggested values? Each of the 5 of us in office have all got wildly different values for both the camera and laser boresight. While this is not a serious issue on data that is collected from a short distance, the effects of poor boresighting are dramatically noticeable on longer range measurements.
Here is a link to the data:
https://drive.google.com/file/d/1tuo9MVabQL7UM3ngN344G7xqyRbmW9Og/view?usp=sharing
The method of “visually” aligning data is not common practice in the photogrammetry world and having more quantifiable methods will take a lot of guesswork out of this.
Ok… so I am currently processing this and playing with the settings.
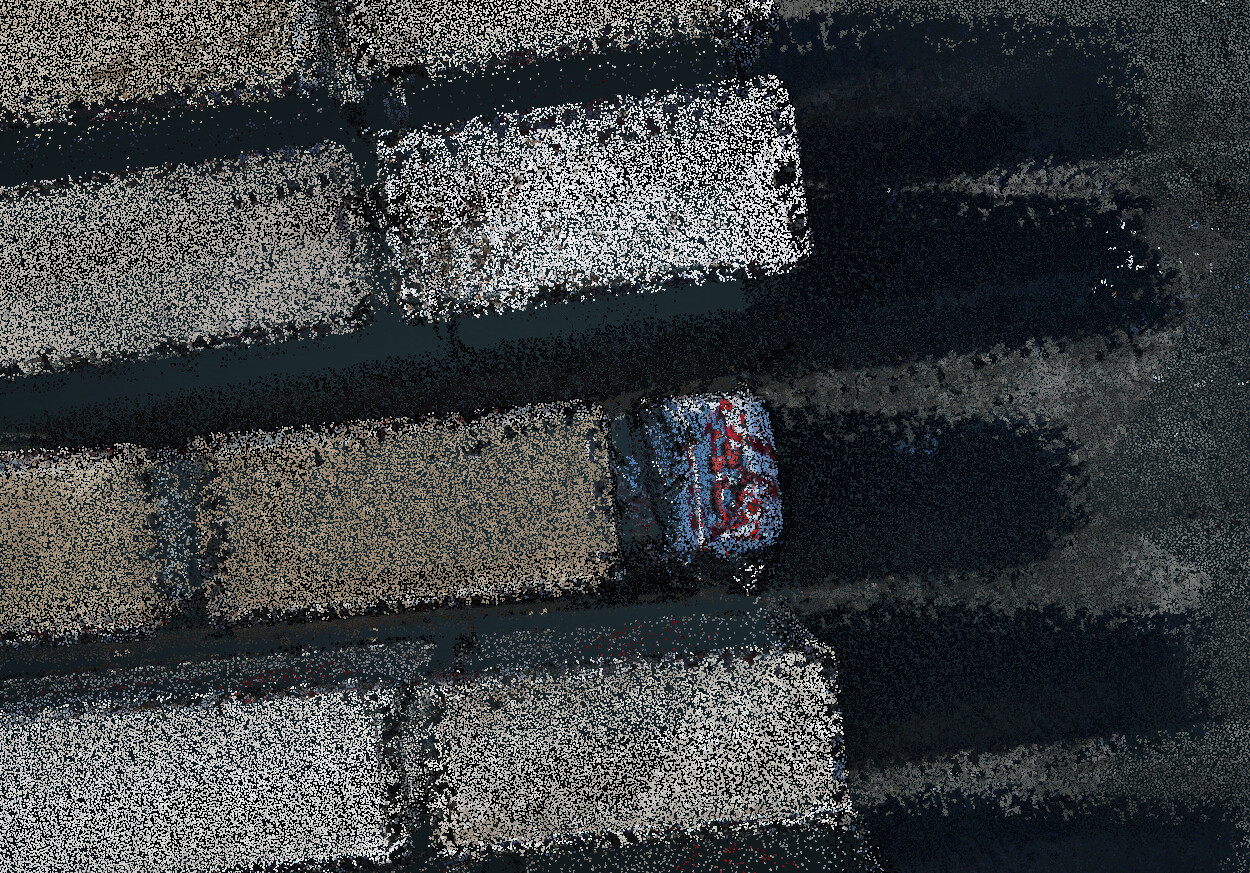
I can see that some photos are “perfect” and other photo locations tend to “smear”. I noticed this on the building in the model… the roof seems to slide off the building on some images, not on others.
So much trial and error… Will let you know.
Do you have any real life pictures you can show us?
Where is this place?
What epsg code do we use when importing the data?
I don’t feel like doing the forensics.
Typically takes a few tries to get some numbers. Its all about iteration?
This is very kind of you to have a look.
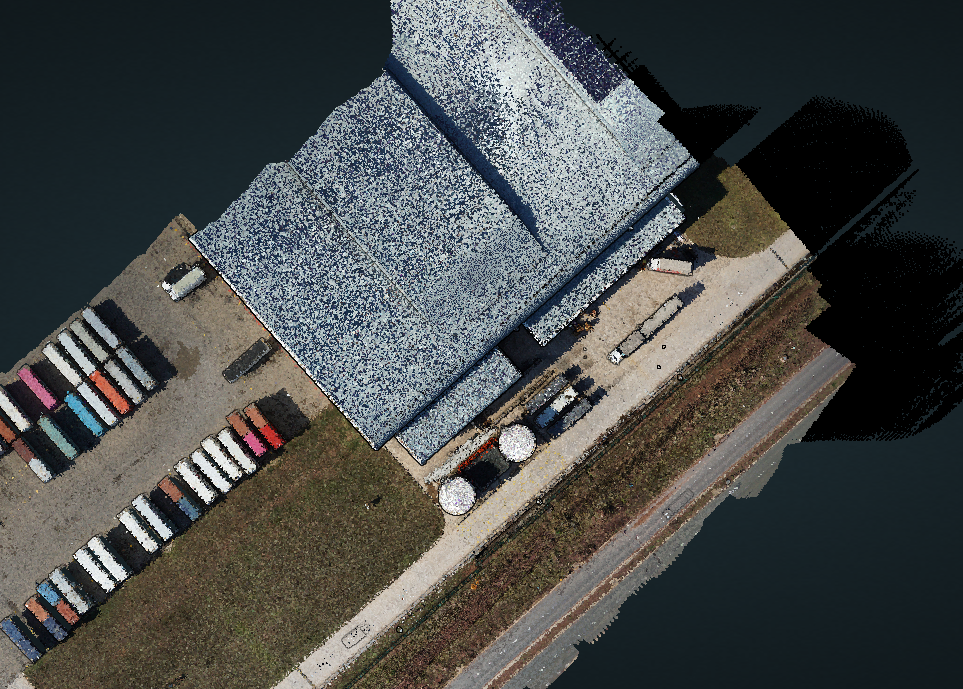
The site is in South Africa. I will send photos of the site tomorrow as I plan to fly the area again, this time a little slower and lower. Perhaps with 2 cross strips.
The EPSG code to be used here is 32736
(WGS 84 / UTM zone 36S).
cool…
I will post some pictures of my “results” later.
There is much shadow and interesting “noise”… sometimes I’ve noticed that the camera paints everything it sees… because the laser shoots so far…
I like my color to be spot on too.
I remembered we have a “camera” folder in the files… Those images are perfect.
If you do fly, cross hatch would be good… or maybe tighten the overlap?
Another idea I am having… Are you able to increase the frequency of your photos?
From experience, too many photos is just as horrible as not enough. I would decrease the interval between your images by one second? A few more images may help with the shadow and alignment of the seacans.
Yes, we will fly much tighter tomorrow and with cross strips. The plan is also to increase the over lap of images by flying slower.
We are not overly concerned about the camera to ins boresight as this is really best done with photogrammetry. We have a fairly good setup for thst. But its good to check it against the pc painter method.
We do know that the lidar / ins roll offset is off. This was proven on a data set collected earlier and tested on a DTM thst was surveyed from a full sized Leica ALS. I will share thst data tomorrow along with some images from the results we got.
Alrighty… the model came out of the oven.
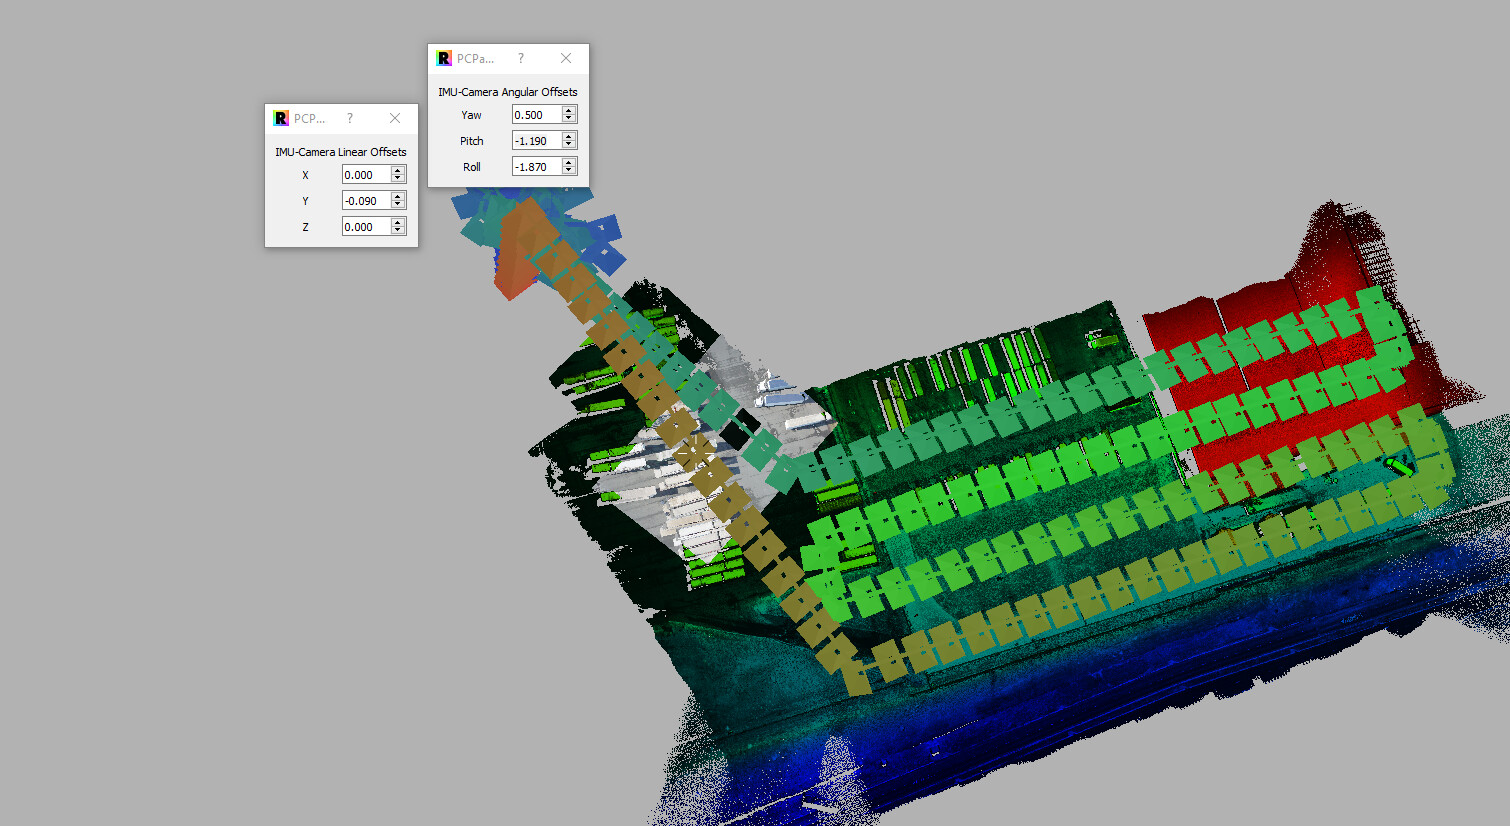
These are MY thoughts and what I would recommend to you if you and I were going to complete this mission together.
I believe I got the color as good as it can be, given the data we have to work with. To increase the “awesome” factor of your lidar scan, you will need to perform a criss-cross pattern, as you have already mentioned. The AGL and speed appear fine, the lidar model could use a few different angles to help fill in the details… Like the sides of the transport trucks and containers that only have half of the object imaged!
The last image is the values I got… the best average from what I had. The photos are like my wife when she paints… the color goes everywhere! I try to look past that and the best “average” is what I use.
As I study my model, I can see small areas where the color slides off the objects, but it is very minor and does not distract. Unless we need millimeter resolution?
What is the end goal of the data? Parking lot storm topography?
Thank you @FlyingRadioWaves .
So as mentioned above, we are not particularly interested in the camera - INS offset as there are far more accurate ways of determining boresight angles from photogrammetry. We also prefer to colorize our point cloud via other methods too later on.
What we are really worried about is the laser to INS offsets. These we are having continual issues with as there is none that we can definitely say is correct as we feel that the method is far too coarse and open to interpretation. Normal or professional photogrammetric approaches allow for the trajectory to be imported into 3rd party software and the laser times matched. Then via quantitative methods, the strips are boresighted and aligned automatically from common structures between strips.
This data supplied is not for any commercial purposes, but only to try and collect some data that can be used for boresighting. Sadly, it is the only suitable (safe) place in our area to collected such data.
Further to that, this morning, the wind was simply too strong for safe flying and we were not able to fly. We are in mission for the next 10 days so will have to wait a while before flying cros strips at a slower speed. Lets hope the call for SBET(or any other trajectory format) gets answered before then.
Here is some reporting that we did that highlights some of the challenges we have had on a commercial job with the laser scanner. This is an extract of our report:
We are having challenges with our boresighting in PCMaster. We would like to check this against our existing software (LiDAR360) but the inputs for the trajectory require SBET or POS (This is standard ASCII but needs to be in PYR format, not OPK that the current trajectory is exported in).
We feel that the visual adjustment of the boresight in PCMaster depends greatly on the dataset you collect and that this is not satisfied in all accounts.
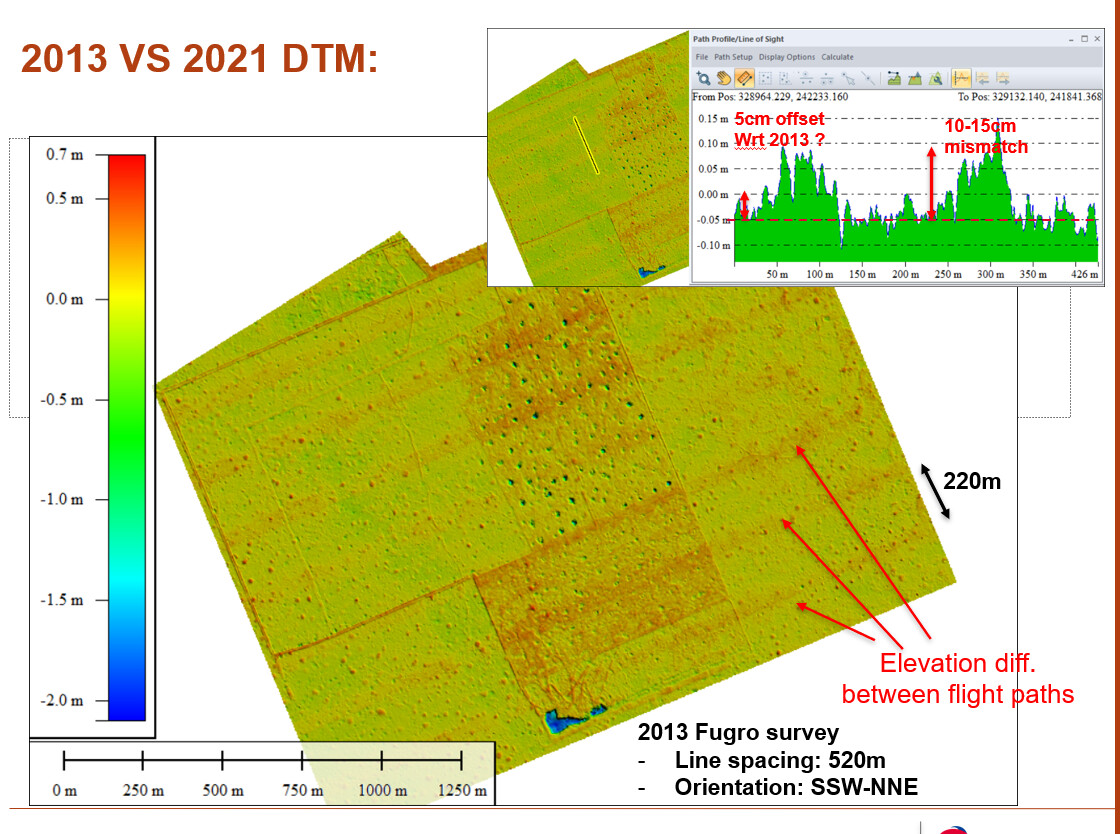
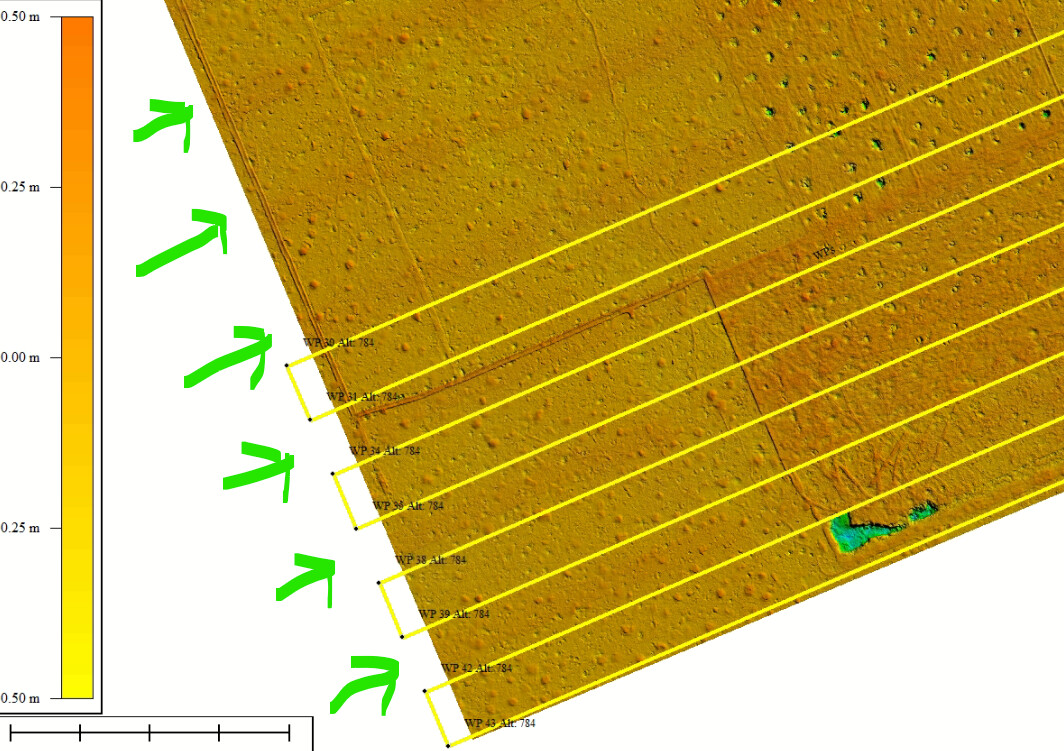
Also, we have some issues with our client regarding a dataset we last collected. The site is currently stripped of vegetation and is bare earth. The site was previously survey via large format LiDAR. Our survey was overlaid and some consistent height anomalies recorded along the flight lines:
The banding corresponds precisely to our flight lines (which were 110m apart with 50% sidelap).
Initially, I felt that the PPM error on the laser may have come into play here with a longer distance to measure at the edges of the scan. But this would not be the case since this only affects certain strips on one side:
The green arrows indicate this error region and the yellow lines are the strips flown. If this was a PPM error, there would be even error on both sides of the track.
We are pretty sure that this is a bore sighting issue (most likely in the roll orientation) as this would coincide with the errors reported on alternative strips.